El Niño 2026-27 so far
Updated
For August-October 2026, the tropical Pacific ran 1.97 °C above normal, measured on NOAA's El Niño index. No other year since 1950 has had a warmer reading for August-October, except 1997 (+2.07 °C), so 2026 ranks 2nd among 77 years.
NOAA's El Niño index climbed 2.73 °C between January-March 2026 and August-October 2026, from -0.76 °C to +1.97 °C. That was the largest climb in the 77-year record since 1950 for those two three-month periods, ahead of 1997's 2.10 °C.
The outlook from NOAA's Climate Prediction Center (CPC) of November 12, 2026 puts the chance of strong-to-very strong El Niño through January-March 2027 at over 79%. For October-December, CPC gives a chance of 60% that the index reaches +2.5 °C or above, a level no event has hit since 1950.
How this El Niño ranks among the biggest since 1950
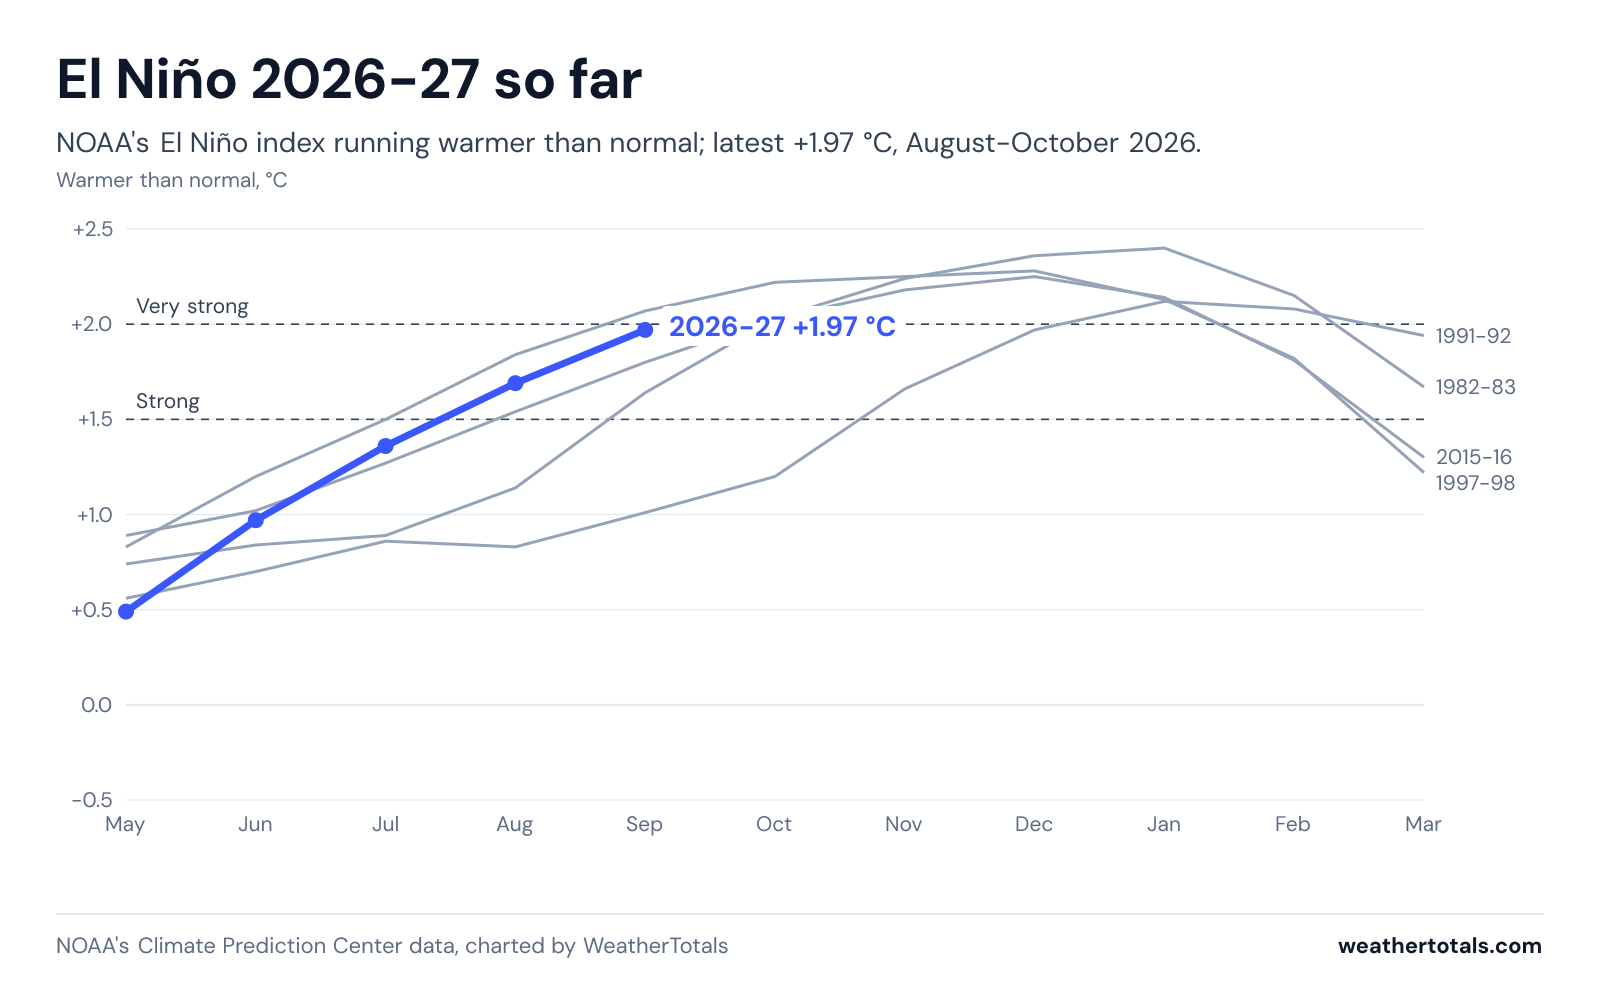
You can use this chart free in any story or on any site as long as you link back. The license is CC BY 4.0. CPC adds a reading each month, and the chart updates then.
NOAA's Climate Prediction Center index, updated daily, one new reading a month.
What the number means
CPC tracks El Niño with one number, the Relative Oceanic Niño Index (RONI). RONI takes the central and eastern tropical Pacific along the equator, finds its departure from normal, subtracts the whole tropics' departure from normal, and averages the result over three months. Ocean-wide temperatures have risen over decades, so CPC removes the whole-tropics warming, which makes a 1960s event and a 2020s event directly comparable; the older version was the Oceanic Niño Index (ONI).
- Conditions become El Niño at +0.5 °C or more
- Strong (+1.5 °C or more)
- Very strong (+2.0 °C or more)
- Super El Niño (news shorthand, usually very strong)
Every strong El Niño since 1950
| Winter | August-October reading | Peak | Class |
|---|---|---|---|
| 2026-27 | +1.97 | +1.97 | |
| 1957-58 | +1.14 | +1.89 | Strong |
| 1965-66 | +1.76 | +1.99 | Strong |
| 1972-73 | +1.64 | +1.97 | Strong |
| 1982-83 | +1.64 | +2.40 | Very strong |
| 1991-92 | +1.01 | +2.12 | Very strong |
| 1997-98 | +2.07 | +2.28 | Very strong |
| 2015-16 | +1.80 | +2.25 | Very strong |
Under 17 U.S.C. 105, no copyright attaches to the government-produced figures on this page, including reports, alerts, station observations, and normals, which were created by the National Weather Service and other NOAA offices. The notice that 17 U.S.C. 403 requires appears in this sentence. It does not imply endorsement by or affiliation with those agencies. See: Data sources and attribution.
What makes an El Niño super
Super El Niño is news shorthand with no official meaning, usually used for very strong events. On the current index, the strongest on record is 1982-83 at +2.4. On the older Oceanic Niño Index, 2015-16 is highest at +2.6.
What strong El Niño winters brought
WeatherTotals' state-by-state record holds what weather stations measured for rain, snow and temperature in each past strong El Niño winter.