Measured by state: El Niño winters across the US
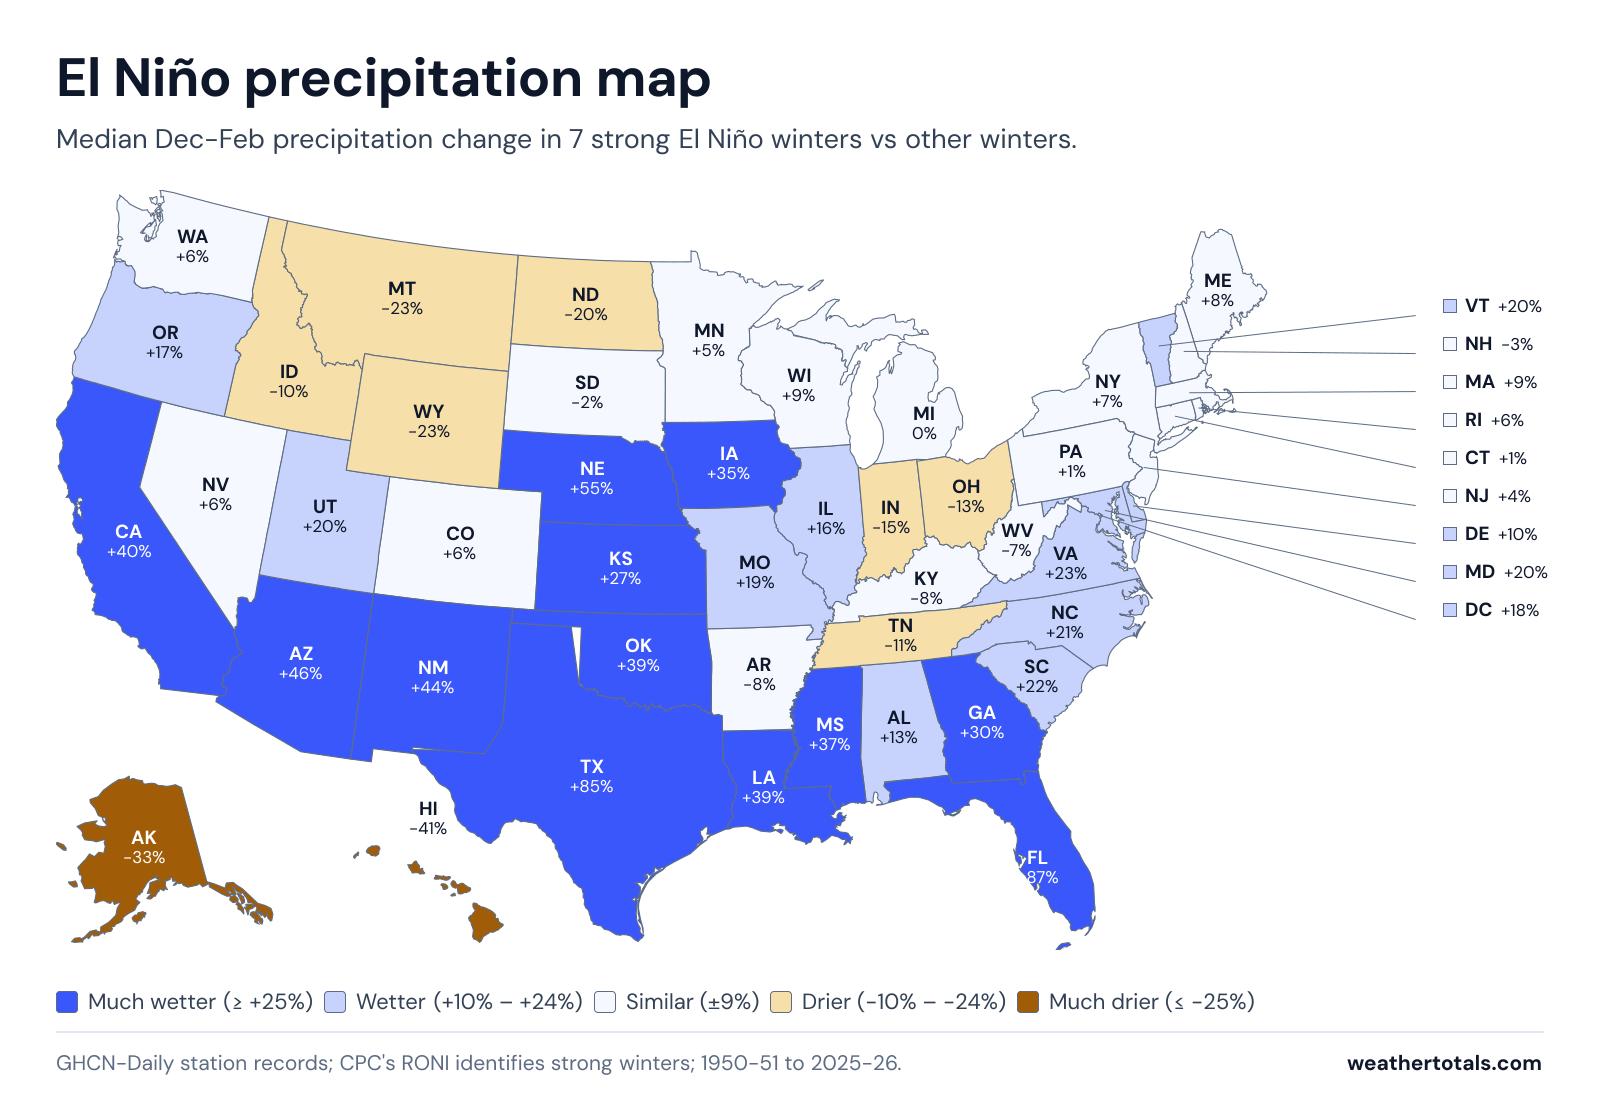
Of the 146 cities with enough station history, 110 averaged more December through February precipitation during the 7 winters since 1950 that were strong El Niños than in other winters. The largest increase was McAllen, Texas at +123%. 99 of the 146 cities also averaged a warmer December through February in strong El Niño winters.
The Climate Prediction Center kept an El Niño Advisory in force in its September 10, 2026 discussion and estimated that the chance of a very strong event in fall and winter 2026-27 is over 90%. The maps and tables below show what past strong winters measured.
El Niño precipitation map
El Niño snowfall map
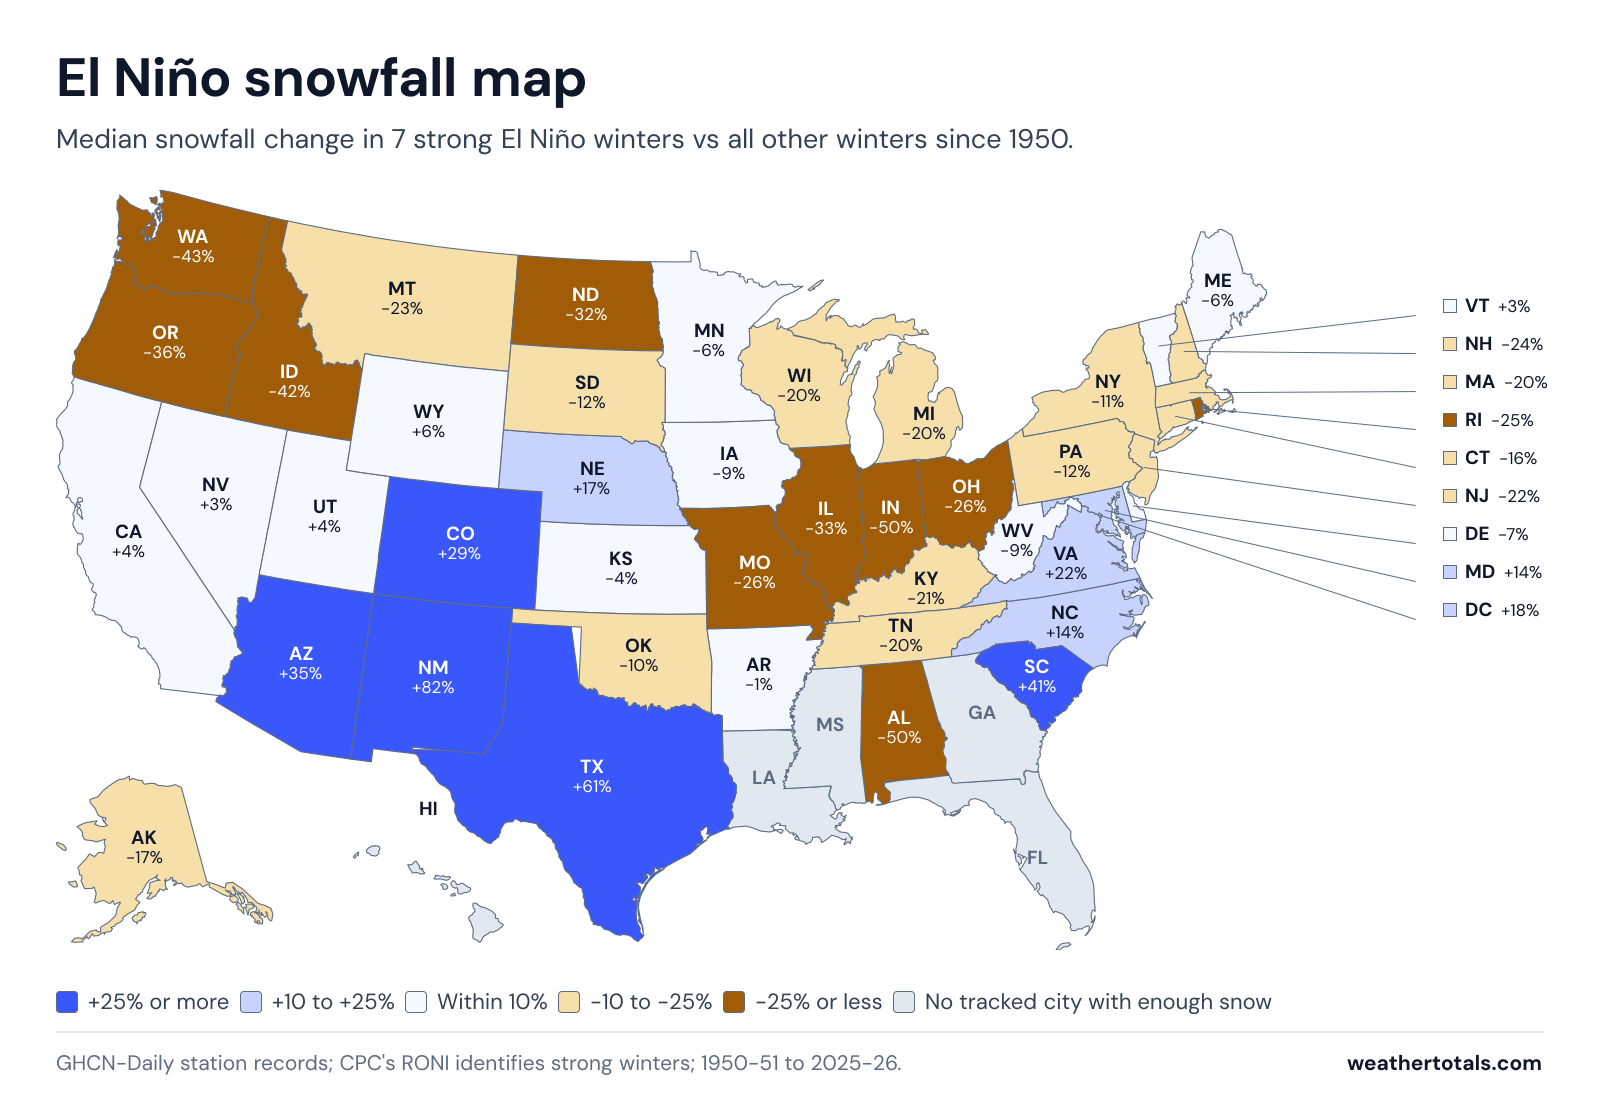
El Niño winters by state
| State | Cities | Precip change | Snow change | Temperature difference |
|---|---|---|---|---|
| Alabama | 3 | +13% | -50% | -0.5°F |
| Alaska | 1 | -33% | -17% | -0.4°F |
| Arizona | 3 | +46% | +35% | -1.3°F |
| Arkansas | 1 | -8% | -1% | +1.1°F |
| California | 18 | +40% | +4% | 0.0°F |
| Colorado | 2 | +6% | +29% | +0.8°F |
| Connecticut | 1 | +1% | -16% | +2.5°F |
| DC | 1 | +18% | +18% | +1.5°F |
| Delaware | 1 | +10% | -7% | +2.3°F |
| Florida | 10 | +87% | No snow comparison | -0.9°F |
| Georgia | 2 | +30% | No snow comparison | -0.3°F |
| Hawaii | 3 | -41% | No snow comparison | -0.2°F |
| Idaho | 1 | -10% | -42% | +2.1°F |
| Illinois | 2 | +16% | -33% | +3.9°F |
| Indiana | 2 | -15% | -50% | +3.7°F |
| Iowa | 2 | +35% | -9% | +3.9°F |
| Kansas | 2 | +27% | -4% | +2.5°F |
| Kentucky | 2 | -8% | -21% | +1.9°F |
| Louisiana | 3 | +39% | No snow comparison | -0.7°F |
| Maine | 2 | +8% | -6% | +1.8°F |
| Maryland | 1 | +20% | +14% | +1.1°F |
| Massachusetts | 2 | +9% | -20% | +2.0°F |
| Michigan | 4 | 0% | -20% | +3.8°F |
| Minnesota | 2 | +5% | -6% | +4.1°F |
| Mississippi | 1 | +37% | No snow comparison | +0.2°F |
| Missouri | 3 | +19% | -26% | +2.5°F |
| Montana | 2 | -23% | -23% | +3.2°F |
| Nebraska | 2 | +55% | +17% | +3.7°F |
| Nevada | 2 | +6% | +3% | -0.9°F |
| New Hampshire | 1 | -3% | -24% | +2.6°F |
| New Jersey | 2 | +4% | -22% | +2.5°F |
| New Mexico | 1 | +44% | +82% | -1.6°F |
| New York | 6 | +7% | -11% | +2.6°F |
| North Carolina | 5 | +21% | +14% | +0.4°F |
| North Dakota | 2 | -20% | -32% | +5.6°F |
| Ohio | 3 | -13% | -26% | +2.8°F |
| Oklahoma | 2 | +39% | -10% | +1.6°F |
| Oregon | 3 | +17% | -36% | +1.1°F |
| Pennsylvania | 6 | +1% | -12% | +2.4°F |
| Rhode Island | 1 | +6% | -25% | +2.5°F |
| South Carolina | 3 | +22% | +41% | -0.1°F |
| South Dakota | 2 | -2% | -12% | +4.2°F |
| Tennessee | 3 | -11% | -20% | +0.7°F |
| Texas | 12 | +85% | +61% | -0.8°F |
| Utah | 1 | +20% | +4% | +0.1°F |
| Vermont | 1 | +20% | +3% | +1.9°F |
| Virginia | 3 | +23% | +22% | +0.9°F |
| Washington | 2 | +6% | -43% | +2.7°F |
| West Virginia | 2 | -7% | -9% | +1.4°F |
| Wisconsin | 3 | +9% | -20% | +3.6°F |
| Wyoming | 1 | -23% | +6% | +1.6°F |
Station figures come from GHCN-Daily (NOAA NCEI); strong winters are classified from CPC's RONI; winters cover 1950-51 through 2025-26.
Under 17 U.S.C. 105, no copyright attaches to the government-produced figures on this page, including reports, alerts, station observations, and normals, which were created by the National Weather Service and other NOAA offices. The notice that 17 U.S.C. 403 requires appears in this sentence. It does not imply endorsement by or affiliation with those agencies. See: Data sources and attribution.
Strong El Niño winters since 1950
| Winter | Peak RONI | Class |
|---|---|---|
| 1957-58 | +1.9°C | Strong |
| 1965-66 | +2.0°C | Strong |
| 1972-73 | +2.0°C | Strong |
| 1982-83 | +2.4°C | Very strong |
| 1991-92 | +2.1°C | Very strong |
| 1997-98 | +2.3°C | Very strong |
| 2015-16 | +2.3°C | Very strong |
The 2023-24 winter peaked at +1.4 on the Relative Oceanic Niño Index, so it does not appear in the strong list. Under the older Oceanic Niño Index it reached +2.0 and would have been called strong.
How the comparison works
The Relative Oceanic Niño Index, or RONI, is calculated by taking the sea surface temperature anomaly in the Niño 3.4 region and subtracting the average anomaly across the tropics between 20 degrees north and 20 degrees south, rescaled to the amplitude of the old index. The Climate Prediction Center adopted it as the official ENSO index on February 1, 2026, and this site counts a winter as a strong El Niño when the RONI value is +1.5 degrees Celsius or higher for three or more overlapping three-month seasons in a row. Each city is compared against its own station record: the strong winters since 1950 versus every other winter at the same station, covering December through February precipitation and temperature and the July through June snow season.