White Christmas odds for US cities
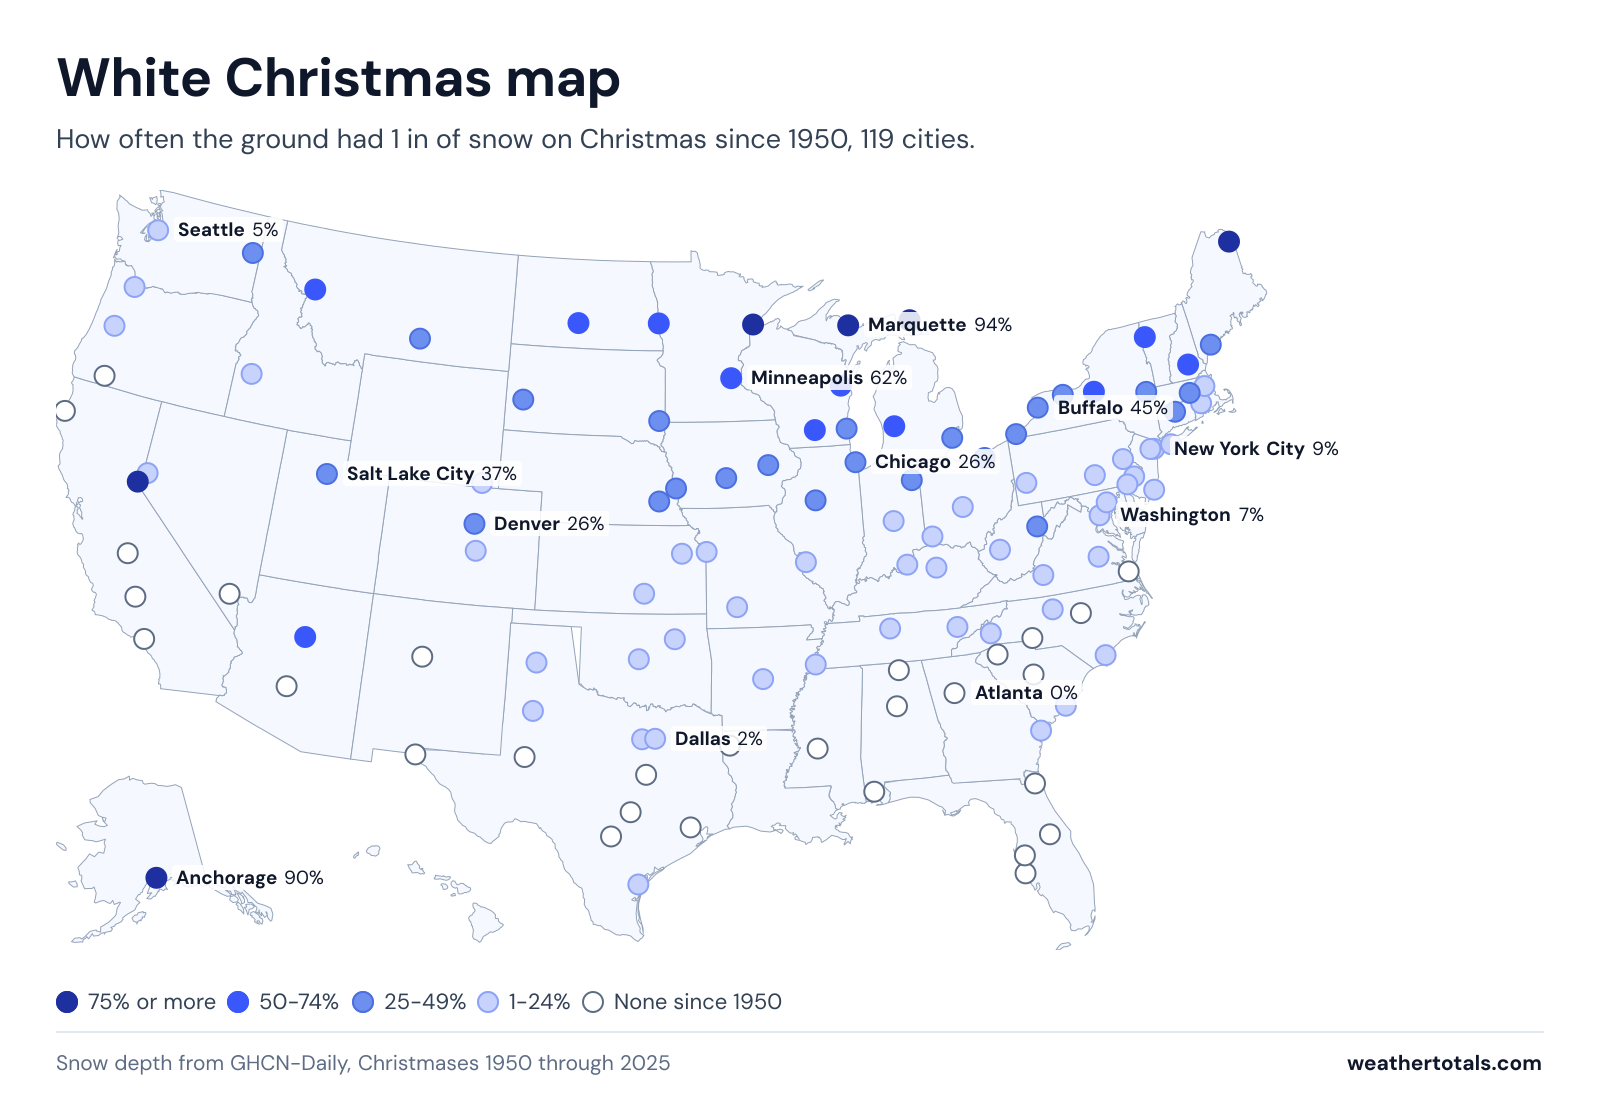
Across 119 cities, snow covered the ground on Christmas in at least half the years since 1950 in 17 of them. The highest is Marquette, Michigan at 94%, while 29 cities have never had one.
Snow covered the ground on 9% of Christmases in New York City (6 of 70); the most recent was 2024.
White Christmas map
What counts as a white Christmas
A white Christmas requires at least 1 inch of snow on the ground for the morning measurement on December 25. That is the definition the National Weather Service and NOAA use. Snow falling during the day on bare ground does not count, and a dusting under 1 inch does not count either.
White Christmas odds by city
| City | State | % white Christmases | White / measured | Last white | El Niño years |
|---|---|---|---|---|---|
| Marquette | Michigan | 94% | 61 of 65 | 2025 | 5 of 6 |
| Sault Ste Marie | Michigan | 92% | 68 of 74 | 2025 | 5 of 7 |
| Duluth | Minnesota | 91% | 69 of 76 | 2025 | 6 of 7 |
| Anchorage | Alaska | 90% | 66 of 73 | 2025 | 7 of 7 |
| Caribou | Maine | 88% | 67 of 76 | 2024 | 6 of 7 |
| Tahoe City | California | 80% | 59 of 74 | 2025 | 7 of 7 |
| Fargo | North Dakota | 71% | 52 of 73 | 2025 | 3 of 7 |
| Minneapolis | Minnesota | 62% | 47 of 76 | 2025 | 2 of 7 |
| Syracuse | New York | 61% | 46 of 76 | 2024 | 0 of 7 |
| Concord | New Hampshire | 60% | 44 of 73 | 2025 | 3 of 7 |
| Burlington | Vermont | 59% | 45 of 76 | 2025 | 2 of 7 |
| Grand Rapids | Michigan | 56% | 35 of 63 | 2022 | 2 of 6 |
| Bismarck | North Dakota | 54% | 41 of 76 | 2022 | 1 of 7 |
| Madison | Wisconsin | 54% | 41 of 76 | 2024 | 3 of 7 |
| Green Bay | Wisconsin | 53% | 40 of 76 | 2024 | 1 of 7 |
| Flagstaff | Arizona | 50% | 32 of 64 | 2021 | 5 of 6 |
| Missoula | Montana | 50% | 38 of 76 | 2022 | 2 of 7 |
| Rochester | New York | 49% | 37 of 76 | 2024 | 1 of 7 |
| Portland | Maine | 47% | 36 of 76 | 2025 | 4 of 7 |
| Buffalo | New York | 45% | 34 of 76 | 2024 | 0 of 7 |
| Sioux Falls | South Dakota | 45% | 34 of 76 | 2022 | 1 of 7 |
| Spokane | Washington | 43% | 32 of 75 | 2022 | 2 of 7 |
| Erie | Pennsylvania | 40% | 27 of 68 | 2022 | 0 of 6 |
| Albany | New York | 38% | 29 of 76 | 2024 | 2 of 7 |
| Billings | Montana | 37% | 28 of 76 | 2023 | 2 of 7 |
| Salt Lake City | Utah | 37% | 28 of 76 | 2022 | 2 of 7 |
| Milwaukee | Wisconsin | 36% | 27 of 76 | 2024 | 2 of 7 |
| Cedar Rapids | Iowa | 35% | 26 of 75 | 2022 | 2 of 7 |
| Detroit | Michigan | 34% | 23 of 68 | 2022 | 0 of 6 |
| Worcester | Massachusetts | 34% | 25 of 73 | 2025 | 2 of 7 |
| Des Moines | Iowa | 33% | 25 of 76 | 2022 | 4 of 7 |
| Elkins | West Virginia | 31% | 22 of 72 | 2022 | 0 of 7 |
| Cleveland | Ohio | 30% | 23 of 76 | 2022 | 0 of 7 |
| Fort Wayne | Indiana | 29% | 22 of 76 | 2022 | 0 of 7 |
| Hartford | Connecticut | 28% | 16 of 58 | 2021 | 0 of 5 |
| Chicago | Illinois | 26% | 17 of 66 | 2022 | 1 of 6 |
| Denver | Colorado | 26% | 20 of 76 | 2022 | 3 of 7 |
| Lincoln | Nebraska | 26% | 15 of 57 | 2022 | 2 of 5 |
| Omaha | Nebraska | 25% | 19 of 75 | 2022 | 1 of 7 |
| Peoria | Illinois | 25% | 19 of 75 | 2022 | 2 of 7 |
| Rapid City | South Dakota | 25% | 18 of 73 | 2017 | 0 of 7 |
| Boise | Idaho | 24% | 18 of 76 | 2022 | 3 of 7 |
| Boston | Massachusetts | 20% | 15 of 75 | 2024 | 1 of 7 |
| Pittsburgh | Pennsylvania | 20% | 15 of 76 | 2022 | 0 of 7 |
| Cheyenne | Wyoming | 18% | 14 of 76 | 2021 | 2 of 7 |
| Columbus | Ohio | 17% | 13 of 76 | 2022 | 0 of 7 |
| Harrisburg | Pennsylvania | 17% | 13 of 76 | 2009 | 0 of 7 |
| Indianapolis | Indiana | 17% | 13 of 76 | 2022 | 0 of 7 |
| Kansas City | Missouri | 17% | 9 of 54 | 2022 | 1 of 5 |
| Topeka | Kansas | 17% | 13 of 76 | 2022 | 2 of 7 |
| Allentown | Pennsylvania | 16% | 12 of 75 | 2012 | 0 of 6 |
| Colorado Springs | Colorado | 15% | 11 of 75 | 2011 | 1 of 7 |
| Charleston | West Virginia | 14% | 11 of 76 | 2022 | 0 of 7 |
| St Louis | Missouri | 14% | 11 of 76 | 2022 | 0 of 7 |
| Islip | New York | 13% | 8 of 62 | 2013 | 0 of 6 |
| Providence | Rhode Island | 13% | 9 of 72 | 2021 | 0 of 7 |
| Cincinnati | Ohio | 12% | 9 of 76 | 2022 | 0 of 7 |
| Reno | Nevada | 12% | 8 of 68 | 2015 | 2 of 6 |
| Newark | New Jersey | 11% | 8 of 76 | 2009 | 0 of 7 |
| Springfield | Missouri | 11% | 8 of 75 | 2022 | 0 of 7 |
| Wichita | Kansas | 11% | 8 of 73 | 2022 | 0 of 7 |
| Baltimore | Maryland | 9% | 7 of 76 | 2009 | 0 of 7 |
| New York City | New York | 9% | 6 of 70 | 2024 | 0 of 6 |
| Roanoke | Virginia | 9% | 7 of 76 | 2020 | 0 of 7 |
| Amarillo | Texas | 7% | 5 of 76 | 2004 | 1 of 7 |
| Knoxville | Tennessee | 7% | 5 of 71 | 2020 | 0 of 7 |
| Lexington | Kentucky | 7% | 5 of 76 | 2022 | 0 of 7 |
| Louisville | Kentucky | 7% | 5 of 76 | 2022 | 0 of 7 |
| Washington | DC | 7% | 5 of 75 | 2009 | 0 of 7 |
| Wilmington | Delaware | 7% | 5 of 76 | 2009 | 0 of 7 |
| Asheville | North Carolina | 6% | 4 of 67 | 2020 | 0 of 6 |
| Atlantic City | New Jersey | 6% | 4 of 67 | 2009 | 0 of 6 |
| Philadelphia | Pennsylvania | 5% | 4 of 76 | 2009 | 0 of 7 |
| Richmond | Virginia | 5% | 3 of 66 | 2009 | 0 of 7 |
| Seattle | Washington | 5% | 3 of 64 | 2017 | 1 of 6 |
| Lubbock | Texas | 4% | 3 of 76 | 2011 | 0 of 7 |
| Nashville | Tennessee | 4% | 3 of 68 | 1966 | 0 of 6 |
| Memphis | Tennessee | 3% | 2 of 70 | 1963 | 0 of 7 |
| Oklahoma City | Oklahoma | 3% | 2 of 75 | 2009 | 0 of 7 |
| Tulsa | Oklahoma | 3% | 2 of 76 | 2009 | 0 of 7 |
| Dallas | Texas | 2% | 1 of 66 | 2009 | 0 of 6 |
| Charleston | South Carolina | 1% | 1 of 76 | 1989 | 0 of 7 |
| Corpus Christi | Texas | 1% | 1 of 68 | 2004 | 0 of 6 |
| Eugene | Oregon | 1% | 1 of 76 | 1983 | 0 of 7 |
| Fort Worth | Texas | 1% | 1 of 68 | 2009 | 0 of 6 |
| Greensboro | North Carolina | 1% | 1 of 76 | 1966 | 0 of 7 |
| Little Rock | Arkansas | 1% | 1 of 75 | 1963 | 0 of 7 |
| Portland | Oregon | 1% | 1 of 76 | 2008 | 0 of 7 |
| Savannah | Georgia | 1% | 1 of 76 | 1989 | 0 of 7 |
| Wilmington | North Carolina | 1% | 1 of 76 | 1989 | 0 of 7 |
| Albuquerque | New Mexico | 0% | 0 of 76 | None since 1950 | 0 of 7 |
| Atlanta | Georgia | 0% | 0 of 73 | None since 1950 | 0 of 7 |
| Austin | Texas | 0% | 0 of 75 | None since 1950 | 0 of 7 |
| Bakersfield | California | 0% | 0 of 76 | None since 1950 | 0 of 7 |
| Birmingham | Alabama | 0% | 0 of 76 | None since 1950 | 0 of 7 |
| Charlotte | North Carolina | 0% | 0 of 76 | None since 1950 | 0 of 7 |
| Columbia | South Carolina | 0% | 0 of 76 | None since 1950 | 0 of 7 |
| El Paso | Texas | 0% | 0 of 65 | None since 1950 | 0 of 6 |
| Eureka | California | 0% | 0 of 76 | None since 1950 | 0 of 7 |
| Fresno | California | 0% | 0 of 76 | None since 1950 | 0 of 7 |
| Greenville | South Carolina | 0% | 0 of 64 | None since 1950 | 0 of 6 |
| Houston | Texas | 0% | 0 of 57 | None since 1950 | 0 of 5 |
| Huntsville | Alabama | 0% | 0 of 61 | None since 1950 | 0 of 5 |
| Jackson | Mississippi | 0% | 0 of 75 | None since 1950 | 0 of 7 |
| Jacksonville | Florida | 0% | 0 of 63 | None since 1950 | 0 of 6 |
| Las Vegas | Nevada | 0% | 0 of 76 | None since 1950 | 0 of 7 |
| Los Angeles | California | 0% | 0 of 76 | None since 1950 | 0 of 7 |
| Medford | Oregon | 0% | 0 of 70 | None since 1950 | 0 of 7 |
| Midland | Texas | 0% | 0 of 75 | None since 1950 | 0 of 7 |
| Mobile | Alabama | 0% | 0 of 75 | None since 1950 | 0 of 7 |
| Norfolk | Virginia | 0% | 0 of 56 | None since 1950 | 0 of 5 |
| Orlando | Florida | 0% | 0 of 71 | None since 1950 | 0 of 6 |
| Phoenix | Arizona | 0% | 0 of 75 | None since 1950 | 0 of 7 |
| Raleigh | North Carolina | 0% | 0 of 76 | None since 1950 | 0 of 7 |
| San Antonio | Texas | 0% | 0 of 72 | None since 1950 | 0 of 6 |
| Sarasota | Florida | 0% | 0 of 74 | None since 1950 | 0 of 7 |
| Shreveport | Louisiana | 0% | 0 of 76 | None since 1950 | 0 of 7 |
| Tampa | Florida | 0% | 0 of 75 | None since 1950 | 0 of 7 |
| Waco | Texas | 0% | 0 of 68 | None since 1950 | 0 of 6 |
Snow depth from GHCN-Daily, Christmases 1950 through 2025
Under 17 U.S.C. 105, no copyright attaches to the government-produced figures on this page, including reports, alerts, station observations, and normals, which were created by the National Weather Service and other NOAA offices. The notice that 17 U.S.C. 403 requires appears in this sentence. It does not imply endorsement by or affiliation with those agencies. See: Data sources and attribution.
White Christmas in El Niño years
For the 90 cities with a white Christmas in their records, a white Christmas came in 18% of strong El Niño years, against 28% in other years. The share was lower in 58 of them.
How the odds are measured
Each city uses morning snow depth from one official GHCN-Daily station for Christmases 1950 to 2025. A city appears in the table when at least 50 Christmases have been measured at that station since 1950, and at least 8 of the most recent 10 were measured.