Skip to content
WeatherTotals

How much rain is a lot?

Updated

A day that brings an inch of rain counts as a lot. In 145 measured U.S. cities, 9.2 days a year is the median count for that much rain; Hilo, Hawaii has the most at 28 days, while Boise, Idaho almost never gets it.

Daily rain totals, from light to extreme

Daily rain totals, from light to extreme
Amount (in)Days a yearWhat it looks like
0.171.3Wets surfaces but barely soaks into the ground.
0.2547.2Steady rain that leaves puddles on pavement.
0.524.2Soaks lawns and gardens; gutters start to run.
19.2Heavy; water ponds in places, and dry soil gets a thorough soaking.
21.6A serious downpour; roads and low areas may hold water.
40.1Extreme; flooding likely, rare almost anywhere.

The days column is the median for the 145 cities in the table below. A 3-inch day sits between the 2-inch and 4-inch rows; 5 inches is above the last row.

Rain rates by the hour

The American Meteorological Society's Glossary of Meteorology defines light rain as a trace to 0.10 inches per hour. Moderate rain is 0.11 to 0.30 inches per hour. Heavy rain is any rate above 0.30 inches per hour.

An inch of rain as snow

A long-standing rule of thumb, used by the Weather Bureau since 1875, is 10 inches of snow for every inch of water. A 30-year study of National Weather Service cooperative observer data by Baxter, Graves and Moore (2005) put the national average closer to 13 inches. The actual ratio shifts with storm type and region: wet snow yields less, dry powder yields more.

An inch of rain in gallons

According to the U.S. Geological Survey Water Science School, one inch of rain on one acre equals 27,154 gallons. That same inch falling on a 1,000-square-foot roof adds up to about 623 gallons.

How much rain causes flooding

There is no single rainfall total that guarantees flooding; the rate, how wet or frozen the ground already is, pavement cover, and terrain all play a part. A Flash Flood Warning from the National Weather Service means flooding is happening or about to happen.

Annual heavy rain days by city
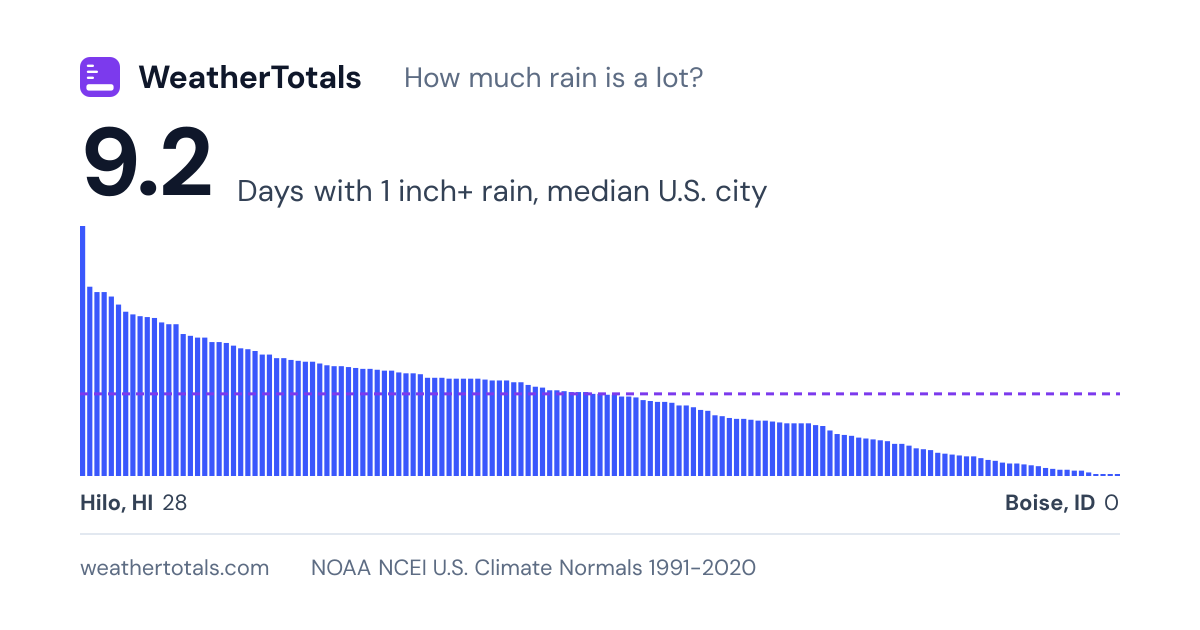
The chart ranks 145 U.S. cities by average days per year with at least 1 inch of rain, highest to lowest. Median 9.2 days; highest Hilo, HI 28, lowest Boise, ID 0. NOAA U.S. Climate Normals 1991-2020.
Average days per year with rain at or above thresholds, selected U.S. cities, 1991-2020.
CityState0.5 in+ days1 in+ days2 in+ daysAnnual total (in)
HiloHawaii66.9289.3120.39
MobileAlabama39.721.26.967.08
PensacolaFlorida4020.67.568.31
MiamiFlorida41.220.66.667.41
New OrleansLouisiana38.320.16.763.35
Baton RougeLouisiana37.419.26.261.94
JacksonMississippi36.818.4557.35
Fort MyersFlorida37.218.14.957.41
MemphisTennessee36.917.94.254.94
WilmingtonNorth Carolina35.817.8560.15
BirminghamAlabama38.517.73.756.62
TallahasseeFlorida37.117.25.358.81
West Palm BeachFlorida37.217561.75
ShreveportLouisiana32.9174.451.43
JacksonvilleFlorida33.315.94.153.40
CharlestonSouth Carolina33.815.73.952.51
HuntsvilleAlabama37.115.5454.29
HoustonTexas31.115.5551.84
OrlandoFlorida33.2153.851.45
TampaFlorida30.7154.449.48
AtlantaGeorgia33.714.93.250.43
Little RockArkansas34.214.64.150.42
KnoxvilleTennessee3614.32.651.93
GreenvilleSouth Carolina32.514.23.449.67
SavannahGeorgia30.9143.548.12
NashvilleTennessee34.213.6350.51
New York CityNew York33.313.62.549.52
NorfolkVirginia30.813.23.449.18
SarasotaFlorida29.413.23.749.05
ColumbiaSouth Carolina29.7132.845.24
AshevilleNorth Carolina33.412.92.849.59
LouisvilleKentucky33.512.82.348.34
ProvidenceRhode Island31.412.82.647.54
Atlantic CityNew Jersey30.912.62.445.96
HartfordConnecticut31.712.41.847.05
AllentownPennsylvania31.312.31.947.36
TulsaOklahoma27.512.32.840.96
SpringfieldMissouri30.312.22.744.71
LexingtonKentucky34.212.11.949.84
WorcesterMassachusetts32.4122.148.26
NewarkNew Jersey32.5122.146.60
PortlandMaine30.911.92.548.12
RichmondVirginia30.311.82.445.50
WilmingtonDelaware31.111.82.345.33
RaleighNorth Carolina30.411.62.346.07
IslipNew York30.611.52.545.99
CharlotteNorth Carolina3011.52.343.60
WacoTexas23.211.43.336.40
St LouisMissouri28.4111.941.70
Oklahoma CityOklahoma24112.336.39
AustinTexas22.111336.25
BaltimoreMaryland30.310.92.445.00
PhiladelphiaPennsylvania29.510.92.244.11
GreensboroNorth Carolina29.510.92.343.95
RoanokeVirginia28.910.91.942.82
DallasTexas25.210.92.837.01
CincinnatiOhio30.710.81.945.26
IndianapolisIndiana29.610.71.643.63
Key WestFlorida22.810.7340.44
WichitaKansas22.710.71.934.31
Kansas CityMissouri25.810.52.239.30
TopekaKansas23.410.52.436.53
BostonMassachusetts2910.21.843.59
WashingtonDC28.8101.941.82
Fort WorthTexas23.29.92.635.34
CharlestonWest Virginia30.89.61.146.24
HarrisburgPennsylvania26.69.61.340.98
ConcordNew Hampshire289.51.341.95
EurekaCalifornia28.29.4140.40
ReddingCalifornia249.41.833.52
San AntonioTexas19.29.42.632.38
PeoriaIllinois24.99.21.137.55
Santa RosaCalifornia219.22.633.78
Tahoe CityCalifornia21.59.12.233.28
Corpus ChristiTexas18.79.13.131.74
Fort WayneIndiana25.28.91.339.48
Cedar RapidsIowa22.98.91.735.91
Des MoinesIowa23.98.81.636.55
MadisonWisconsin22.78.51.637.13
ColumbusOhio27.98.41.641.57
Grand RapidsMichigan23.58.31.439.40
ChicagoIllinois23.88.31.537.86
ElkinsWest Virginia29.28.20.947.21
AlbanyNew York27.57.90.940.68
OmahaNebraska20.37.91.331.86
ScrantonPennsylvania23.37.71.138.72
ClevelandOhio24.27.41.141.03
EugeneOregon25.67.30.640.83
MilwaukeeWisconsin22.16.81.134.57
BurlingtonVermont22.96.70.637.53
MinneapolisMinnesota19.76.51.431.62
BuffaloNew York24.66.40.440.68
LincolnNebraska196.41.629.34
PittsburghPennsylvania25.26.30.939.61
EriePennsylvania25.56.20.842.98
MarquetteMichigan20.56.20.636.68
CaribouMaine26.66.10.740.70
Sioux FallsSouth Dakota17.161.427.85
SyracuseNew York23.85.90.639.88
DetroitMichigan21.35.90.734.32
Green BayWisconsin19.65.90.531.61
McAllenTexas12.35.91.922.16
DuluthMinnesota18.45.70.631.18
SeattleWashington23.45.60.439.34
RochesterNew York20.15.10.735.09
AmarilloTexas13.24.70.619.66
Sault Ste MarieMichigan18.34.60.434.46
Santa BarbaraCalifornia11.14.51.317.25
PortlandOregon20.44.30.636.92
FargoNorth Dakota144.20.923.95
San FranciscoCalifornia12.84.10.519.64
LubbockTexas11.340.818.33
San Luis ObispoCalifornia10.13.90.617.94
FlagstaffArizona11.83.60.420.52
HonoluluHawaii83.61.516.41
SacramentoCalifornia12.33.40.518.14
Los AngelesCalifornia8.43.10.512.23
BismarckNorth Dakota10.230.519.05
MidlandTexas92.90.413.51
OxnardCalifornia72.60.512.93
OaklandCalifornia11.62.50.318.68
Rapid CitySouth Dakota8.92.40.217.44
Colorado SpringsColorado7.22.30.615.91
MontereyCalifornia9.52.20.216.24
San DiegoCalifornia6.22.20.19.79
DenverColorado7.220.214.48
CheyenneWyoming7.71.80.115.41
TucsonArizona61.70.210.61
MedfordOregon8.61.50.218.43
BillingsMontana61.40.114.31
San JoseCalifornia7.21.4013.48
El PasoTexas4.51.30.18.78
RiversideCalifornia4.91.209.37
FresnoCalifornia6.71.1010.99
PhoenixArizona4.10.90.17.22
AnchorageAlaska6.40.80.116.42
Salt Lake CityUtah6.90.7015.52
RenoNevada3.30.707.35
AlbuquerqueNew Mexico4.60.608.84
Palm SpringsCalifornia30.604.61
SpokaneWashington5.30.4016.45
MissoulaMontana4.30.2014.11
BakersfieldCalifornia2.90.206.36
Las VegasNevada2.10.204.18
BoiseIdaho3.30011.51

Averages for 1991-2020 come from the U.S. Climate Normals published by NOAA's National Centers for Environmental Information, using one airport or city station per city.

Under 17 U.S.C. 105, no copyright attaches to the government-produced figures on this page, including reports, alerts, station observations, and normals, which were created by the National Weather Service and other NOAA offices. The notice that 17 U.S.C. 403 requires appears in this sentence. It does not imply endorsement by or affiliation with those agencies. See: Data sources and attribution.